What’s the difference between a basic flowchart and a cross-functional flowchart?
A basic flowchart is a great way to visualize a business process for completing a task. It can help you to identify the individual process step that is needed in the entire process, and it can also help to clarify the order in which the process flow needs to be completed.
By creating a basic flowchart, you can ensure that everyone involved in the task is on the same page, and you can avoid any potential confusion or misunderstandings.

However, a cross-functional flowchart can be even more helpful if it also includes individual functions from different departments. This is where a cross-functional flowchart comes in.
A cross-functional flowchart reveals the benefits of both types of charts by adding the relevant department employees into each step on the chart – this way everyone involved will be aware of their role and any related deadlines.
What is a cross-functional flowchart and what are its benefits?
A cross-functional flowchart is a graphical representation of the relationships and flows of work between different departments or functions within a company.
By creating a cross-functional flowchart, you can help employees better understand their individual roles within the company, and improve communication and collaboration among different departments. A cross-functional flowchart can also help to streamline processes and improve efficiency.
Creating a cross-functional flowchart will help break down the barriers that exist between different departments and create a more streamlined process for getting work done. Employees will be able to better understand their individual roles within the company and will be able to communicate more effectively with one another.
How to create cross-functional flowcharts
Start by identifying individual departments within your company. These can be departments like sales, customer service, marketing, and so on. Understand how these departments work together to complete tasks.
![]()
Source: Slidegeeks
Use these steps to create a cross-functional flowchart that depicts the relationships between different departments. Use this diagram to help you create individual process maps that show how different departments work together to complete tasks.
Seven Tips for designing an effective cross-functional flowchart
When creating a cross-functional flowchart, there are a few key things to keep in mind in order to ensure that it is effective. Here are a few tips:
- Start by identifying all of the steps that are involved in any particular process.
- Draw lines between each step that is related to another step.
- Try to be as specific as possible when listing down each step.
- Include all of the steps required for any given process on one chart.
- Avoid simply including tasks as boxes with arrows drawn between them.
- Use icons or symbols that more clearly identify individual responsibilities within the company.
- Label each box with a number that corresponds to steps on an accompanying list of steps and requirements.
Some examples of cross-functional flowcharts
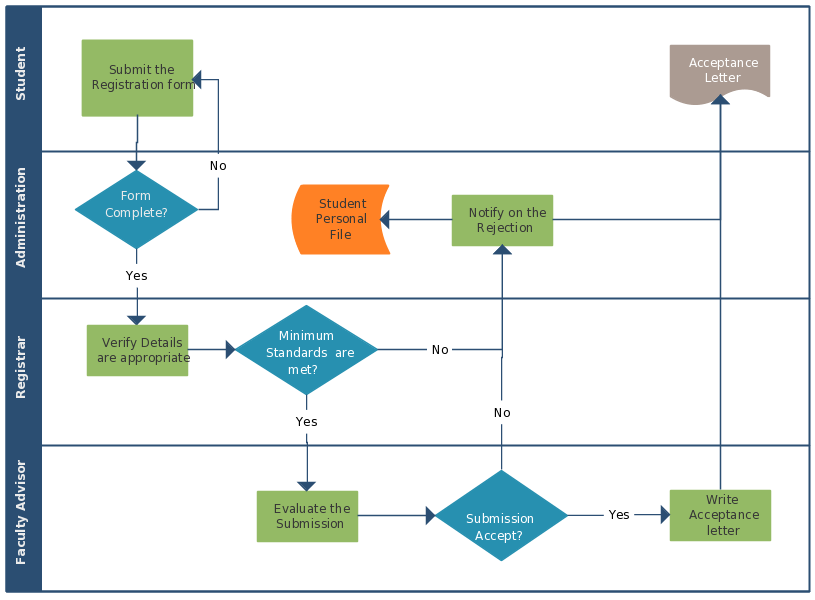
College Admissions
A college may use a cross-functional chart to show the relationship between admissions, financial aid, academic advising, and so on. This will help employees better understand their individual roles within the company, and it will create a more streamlined process for getting tasks done.
Source: Creately
Software deployment flow chart
When it comes to deployment flowcharts, a perfect example is a software. Rolling out new software is a perfect example of an area in your business where it’s critically important to have a well-defined process in place. A deployment flowchart can help you streamline the process and ensure that everything is done correctly.

Source: MyDraw
Creating a deployment flowchart can help ensure that there are no glitches during the software deployment process. It can also help improve communication among team members, and ensure that everyone is aware of their role in the process.
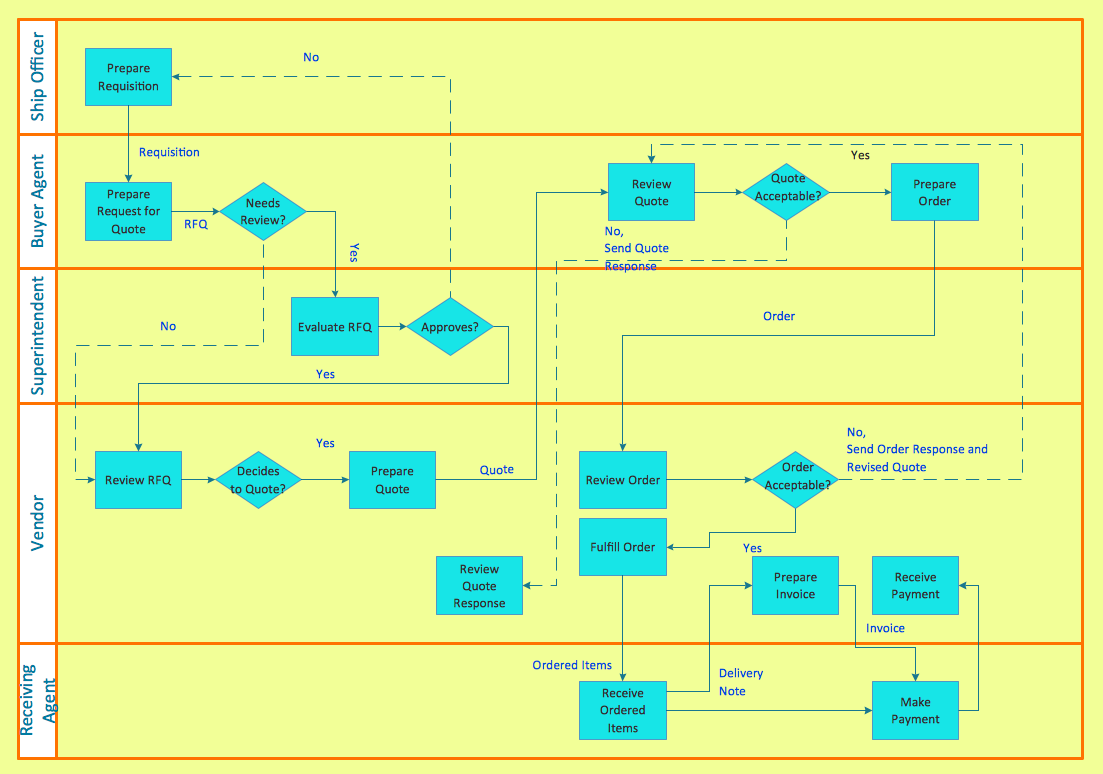
Shipping department overview chart
that shows departments and their sub-departments. It also includes a percentage of the budget that goes into each department, the number of employees in each department, product/service offered by each department, and notable projects that have happened within the company.
Source: Conceptdraw.com
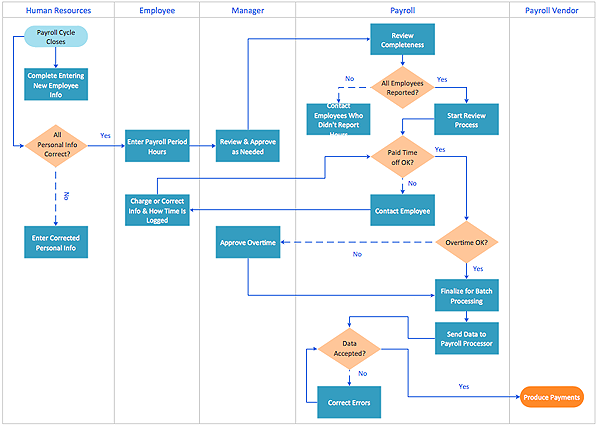
Human resources
Cross-Functional Flowchart Diagram that shows how different departments are related to each other. This functional flowchart example also shows what products or services are offered by certain departments, individual responsibilities within the company, number of employees associated with each department, etc.
Source: Conceptdraw.com
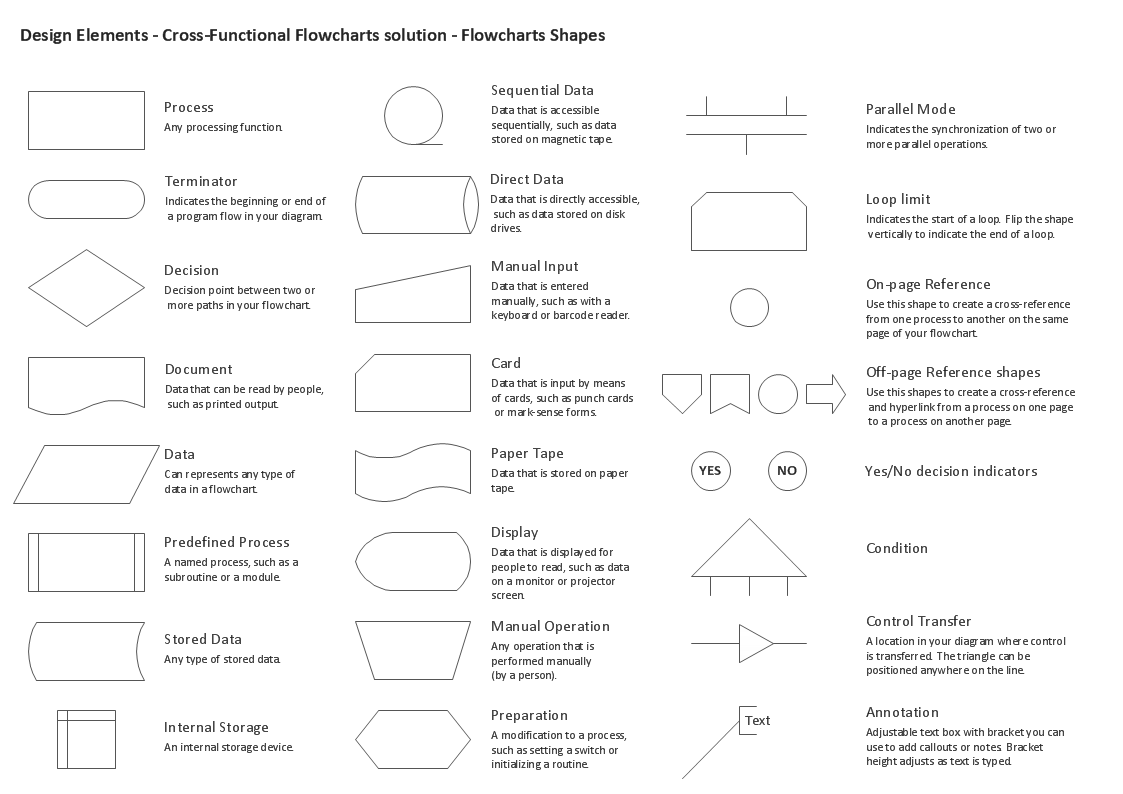
Shapes typically used in a cross-functional flowchart template
There are a variety of different symbols that can be used in a cross-functional flowchart. Some of the most common symbols include:
Shapes
Boxes: These represent individual departments or tasks
Arrows: These represent the flow of information or the sequence of tasks
Circles: These represent points where decisions are made or where tasks intersect
Rectangles: These represent a document or an electronic form
Thick lines: These indicate a primary process, while thin lines indicate a related process
Dashed lines: These indicate that a sequence of tasks is optional
Keywords or phrases: These can be used to note what the cross-functional flowchart represents, as well as to note where potential points of failure may exist.
Here is a more detailed overview:
Here is a quick 2-minute video about the flowchart shapes and symbols:
How can a cross-functional diagram help improve communication?
A cross-functional flowchart can be an excellent tool for improving communication and collaboration among employees in a company.
Breaking down the silos
By creating a cross-functional flowchart, you can help break down the barriers that exist between different departments and create a more streamlined process for getting work done.
A better understanding of individual roles
Employees will be able to better understand their individual roles within the company and will be able to communicate more effectively with one another.
Transformations
Cross-functional diagrams can be particularly helpful when a business entity is undergoing a transformation. Creating a cross-functional flowchart can help employees better understand what changes are being made and how those changes will affect the tasks they perform every day.
Identify weaknesses
Cross-functional flowcharts also make it easier to identify weaknesses within the company’s processes, so that problems can be identified and fixed before they have a chance to turn into larger issues.
Finding process overlaps
Trying to understand how your employee’s work can also help you identify areas where processes may overlap with another department’s work, without actually being helpful towards the ultimate goal of completing a sale.
Final thoughts and tips for your organization
The cross-functional flowchart is a visual representation of how several tasks are related to one another. It can be used as an excellent tool for streamlining processes, improving communication and collaboration among employees in the company.
Here are some tips when getting started in your business:
- When creating a cross-functional flowchart, the first step is to identify all of the steps that are performed in any particular process. For example, if you’re trying to create a cross-functional flowchart for the sales process within your company, you would begin by listing down all of the steps that are performed in order to successfully close a sale.
- On the next step, you would draw lines between each step that is related to another step. For example, under each step for closing a sale, there might be several additional steps related to dealing with customer support issues or potential contracts.
- Finally, when listing down each step, try to be as specific as possible. Each step should have a very clear beginning and end so that it’s easy for employees to understand their individual responsibilities within the process.
- It can also help to include all of the steps required for any given process on one cross-functional flowchart. By including every single task that is performed in order to complete a sale, you’ll be able to identify the steps that are most time-consuming or interruptions along the way.
- When creating cross-functional flowcharts, you should try to avoid simply including tasks as boxes with arrows drawn between them. Instead, use icons or symbols that more clearly identify individual responsibilities within the company. You can also label each box with a number that corresponds to steps on an accompanying list of steps and requirements.
- If at all possible, you should go through this process with your employees and ask them for feedback on your work. Their first-hand knowledge of what’s involved in completing a process can help ensure that the cross-functional flowchart is as accurate and helpful as possible.
A cross-functional flowchart can be an excellent resource for any business, particularly those undergoing a transformation or trying to improve communication and efficiency within their existing workforce. By communicating steps clearly and working with employees to develop cross-functional flowcharts that are as thorough as possible, you’ll be able to keep your business running smoothly.
Seems like a lot of work? Maybe too much…
Developing a process map is an essential step for any business looking to improve communication and efficiency, but it can be difficult to do this effectively without the right resources.
Even if you have the best of intentions, creating a process map can be difficult without expert help. You may not have access to the right software or tools, or you may not know where to start. Without a clear plan, your process map may not be effective.
Profit Pro offers cross-functional flowchart consulting services that will help you develop teams through the facilitation of process mapping key departmental goals and individual responsibilities.
Our team of experts has years of experience in developing and facilitating process maps, so you can trust that your project will be in good hands. Click the button below for a free consultation to determine the value of process mapping to your business and organization.